The market keeps going strong! Curious what’s selling in Sanford? We’ve got the most important real estate market stats for Zip Codes 32771 and 32773 right here – and in simple and easy to digest format!
For those who want to dig deeper, scroll down all the way to download the complete sortable data spreadsheet!
How is the Market Doing?
Just as in previous months, we can confirm that August 2021 has been yet another active month!
It’s not surprising that the market is currently this hot. Traditionally, real estate activity goes up during the summer months, and combining this with low interest rates, low inventory and a steady influx of people moving to the area results in a blazing hot market.
Yet, the big question remains: will this trend continue? Will the demand remain strong? Chances are, with an inventory this low things won’t change anytime soon.
Moving on up?
Thanks to a new Bridge Loan Program, Homeowners who want to move up but need to first sell their home are now able to compete as fully qualified Buyers in this real estate game (no more contingency offers that could get turned down!). If you are interested in this program, we are real estate agents certified in this program who can put you in touch with the right lender. Please contact us here and ask us about the details on this new type of loan.
But now without further ado, let’s look atAugust’s real estate activity in Sanford…
Sanford’s latest Real Estate Numbers
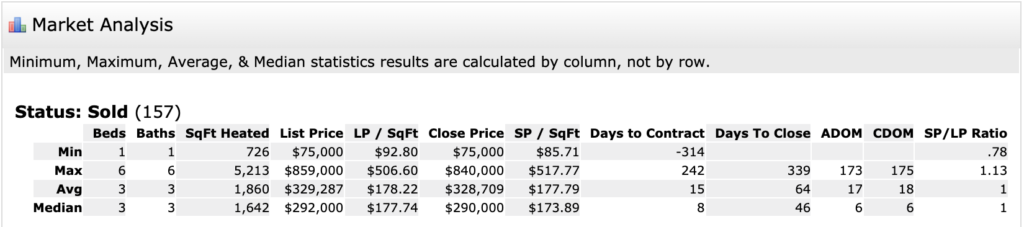
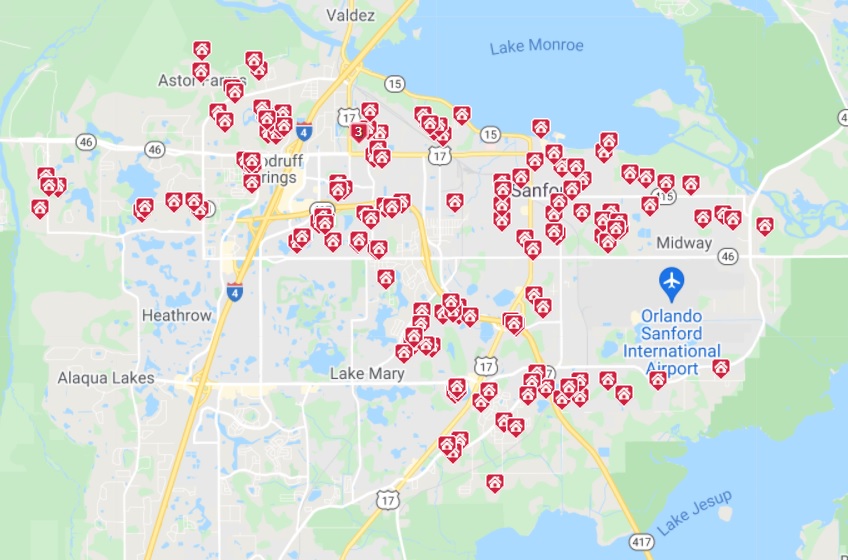
In the month of August 2021, 157 homes sold on MLS. That’s 18 homes more than in July 2021.
For comparison, in August 2020, 132 homes sold on MLS.
Click here to view them all on a map and find out more details about each home.
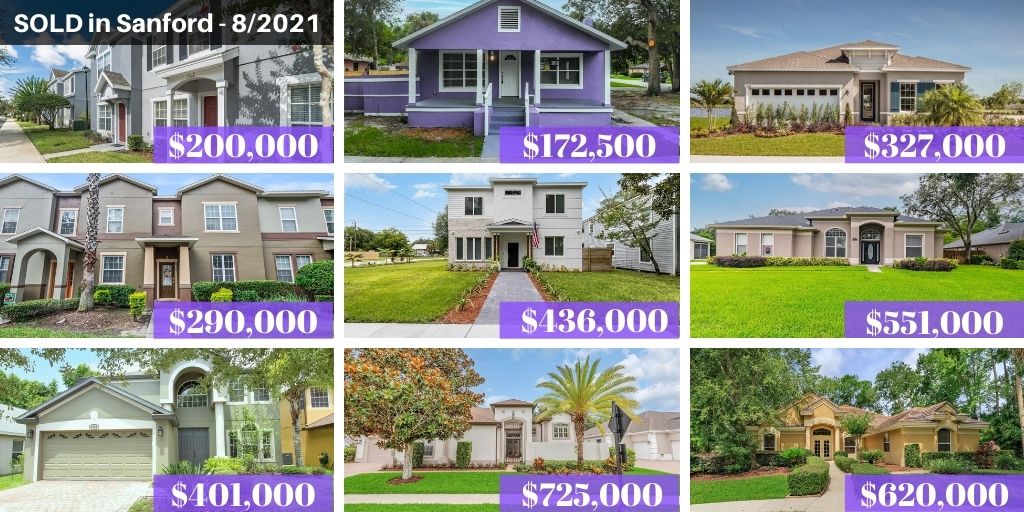
- The average sales price for homes (including Single Family Homes, Townhomes and Condos) sold in August 2021 in Sanford, FL was $329,759 (up from $324,752 in July 2021). For comparison, in August 2020 the average sales price was $291,111, so prices increased by a healthy 11.7%. This increase is a lot less than the increases we have seen in previous months (for example, comparing July 2021 to July 2020 we saw a whopping 20.8% increase in the average price)!
- The average sold price per square foot was $178.27 (up from $174.17 in July).
- The average days on market were 64 days (much more than July’s 17 days but we think this number was skewed by a home that sat in the market for an awful long time).
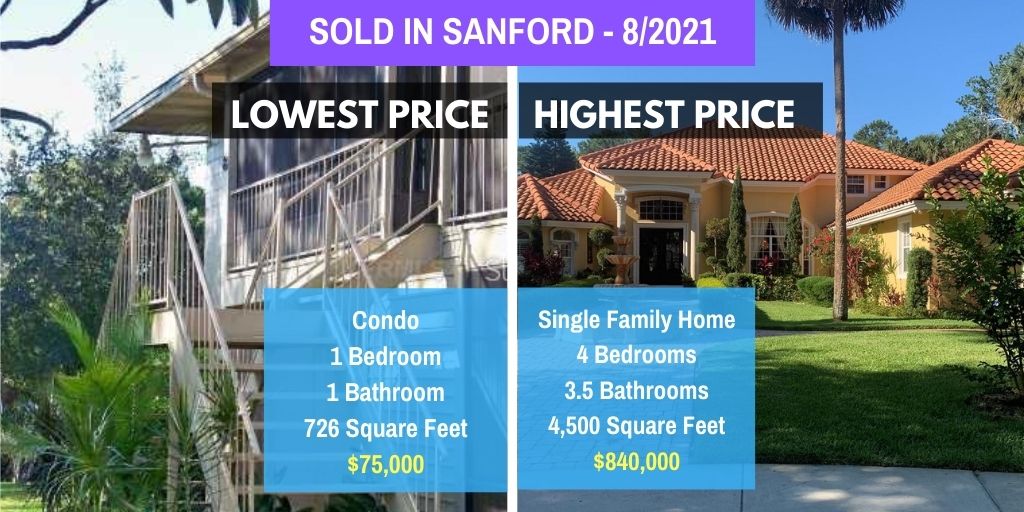
- The lowest priced home in Sanford was a 1 bedroom 1 bathroom Condo of 726 square feet. It sold for $75,000.
- The highest priced home in Sanford last month was a 4 bedrooms, 3.5 bathroom Single Family Home of 4,500 Square Feet. It sold for $840,000.
Click here to view a list of all sold homes in Sanford during the month of August 2021.
As usual, please let us know if you have any questions or would like more information about any of these homes. Jose and I would love to help you with all your real estate needs. You can call or text us at 407-340-6458 or simply contact us here!
Look what’s pending in Sanford:
Let’s take a quick look at a home that is currently pending in Sanford. We absolutely LOVE this custom built Rick Heidenescher home on water, located in the guard gated community of Lake Forest… Check it out here!

For all our beloved real estate nerds (like us)…
Download the sortable spreadsheet here (Excel Format)
Currently for Sale in Sanford
Meanwhile in Central Florida and surrounding areas…
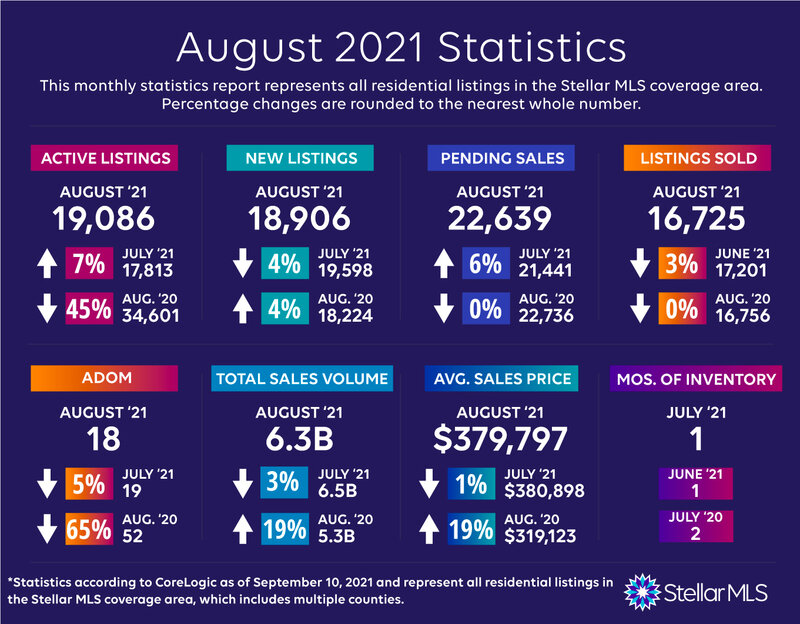
And here a quick look at the overall real estate activity in Central Florida and surrounding areas (Stellar MLS Coverage area) this August as well as a video specifically on the Orlando area…


