Curious what’s selling in Sanford? We’ve got the most important real estate market stats for Zip Codes 32771 and 32773 right here – and in simple and easy to digest format!
For those who want to dig deeper, scroll down all the way to download the complete sortable data spreadsheet!
But first things first.
How is the Market Doing?
As many of you know, spring is traditionally one of the busiest times for real estate. This year though, many home buyers, and probably even more home sellers, have been hesitant to move forward with their buying or selling plans. That’s exactly why we have been seeing a drop in sales for the past two months, not only here in Sanford, but also nationwide. The April 2020 numbers suggest that new listings fell by almost 45% while sales volume dropped by 15%. We expect an uptick in activity though for the coming months as restrictions have eased. The pent up demand of the spring season will likely affect the market in the summer and fall.
What’s Next?
But just where exactly is the housing market headed? Aren’t the record unemployment numbers a sure sign that we are headed into a recession?
That’s probably true.
However, we remain confident that home values will remain stable while the demand for homes still exceeds the available supply – and all signs point to the fact that it will.
In addition to that, government intervention seems to help stabilize the market. For example, the CARES (Coronavirus Aid, Relief, and Economic Security) Act gives pandemic impacted government-backed mortgage holders up to one year of reduced/delayed payments which will most likely prevent a good amount of foreclosures from happening.
The record low mortgage rates that are enticing today’s buyers to make a move are only possible because the Federal Reserve lowered borrowing costs in order to inject liquidity into the mortgage industry.
Sanford’s latest Real Estate Numbers
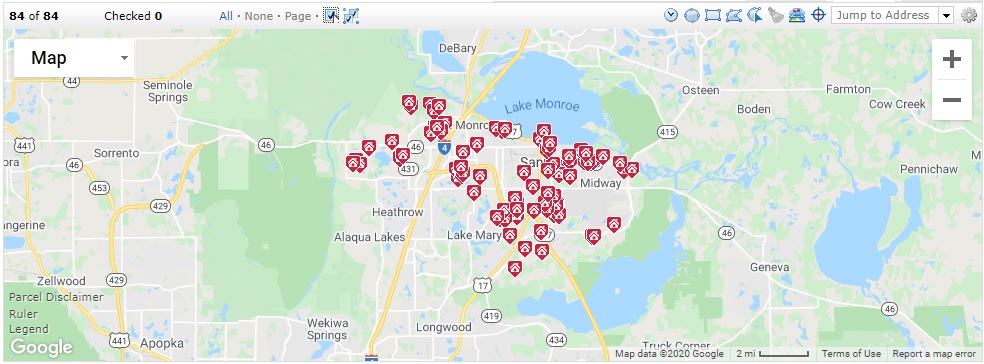
In the month of May 2020, 84 homes sold on MLS. That’s 26 homes less than in April of 2020. For comparison, in May 2019, 172 homes sold on MLS, so numbers dropped significantly compared to the previous year, by a whopping 52%. Now these numbers may seem quite dramatic, however, keep in mind that even though sales are down, home values remain strong, and homes that enter the market sell rather quickly due to the still very low inventory and above mentioned historically low interest rates.

Click here to view them all Sanford real estate sales on a map and find out more details about each home.
- The average sales price for homes (including Single Family Homes, Townhomes and Condos) sold in May 2020 in Sanford, FL was $291,036 (up from $248,304 in April 2020). For comparison, in May 2019 the average sales price was $255,499, so prices increased by 13.9% compared to the the previous year!
- The average sold price per square foot was $148.14 (up from $142.62).
- The average days on market was 41 days (same as last month).
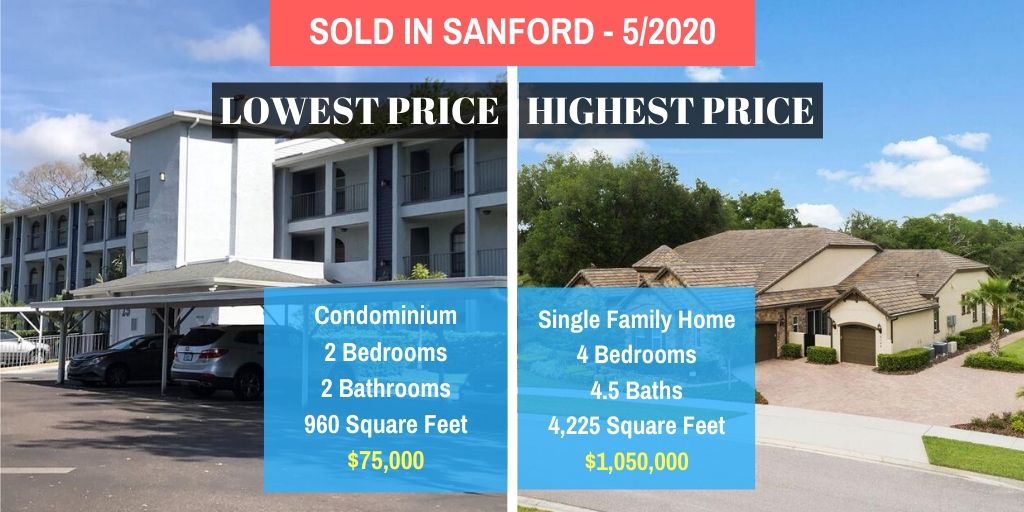
- The lowest priced home in Sanford was a 2/2 Condominium of 960 Square Feet. It sold for $75,000.
- The highest priced home in Sanford last month was a 4 bedroom, 4 and 1/2 bathroom Single Family Home of 4,225 Square Feet. It sold for $1,050,000.
Click here to view a list of all sold homes in Sanford for May 2020.
As usual, please let us know if you have any questions or would like more information about any of these homes. Jose and I would love to help you with all your real estate needs. You can call or text us at 407-340-6458 or complete the form at the bottom of this page!
Look what’s pending in Sanford:
Let’s take a quick look at a home that is currently pending in Sanford. We LOVE this beautiful historic home located in the desirable Historic Residential District of Sanford…
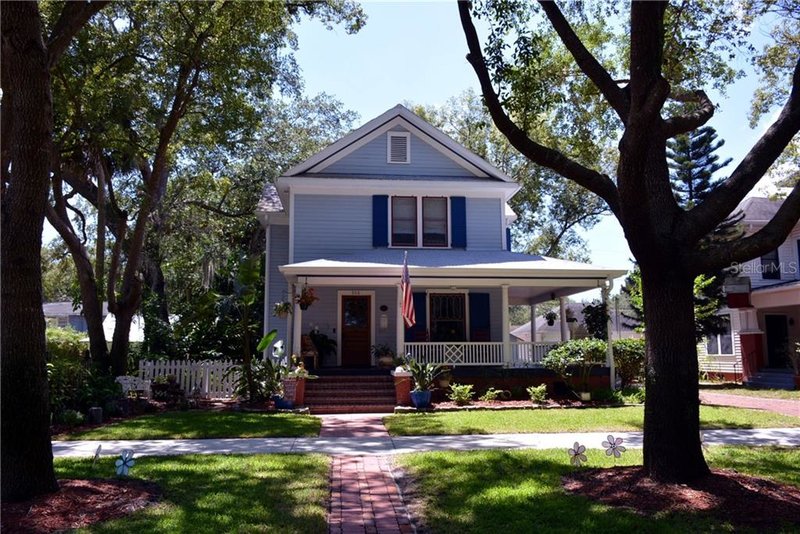
Click here for more details about this home
For all our beloved real estate nerds (like us)…
Download the sortable spreadsheet here (Excel Format)
Meanwhile in Orlando…
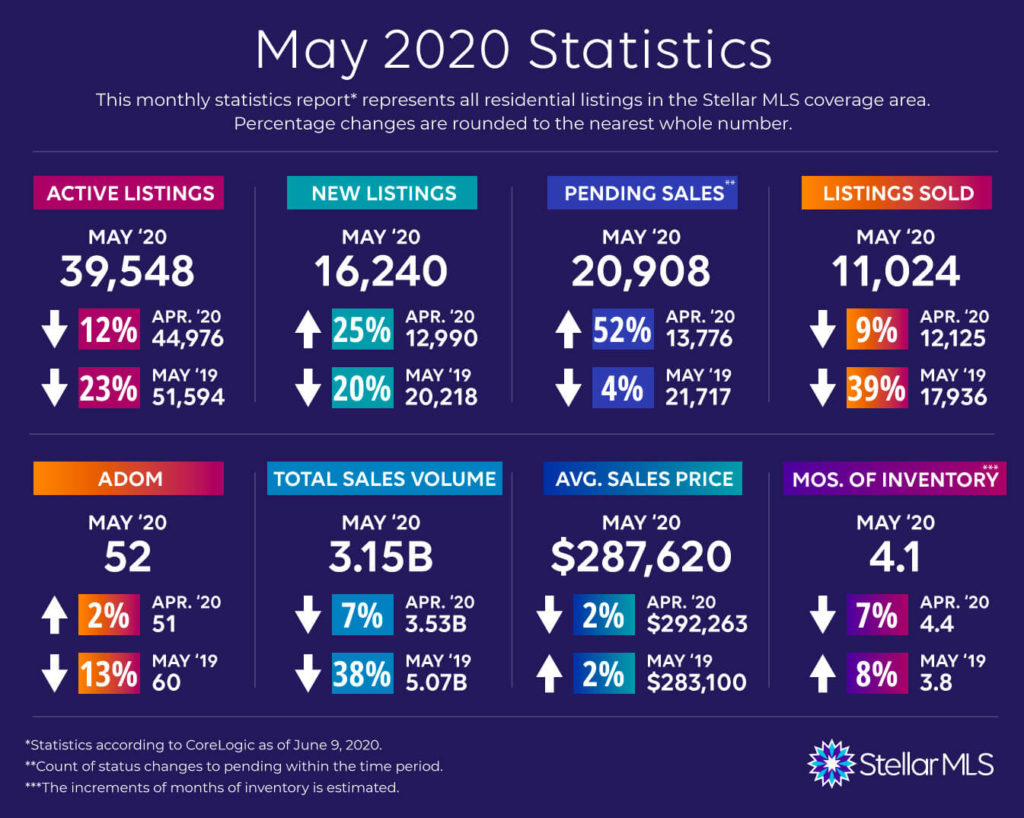
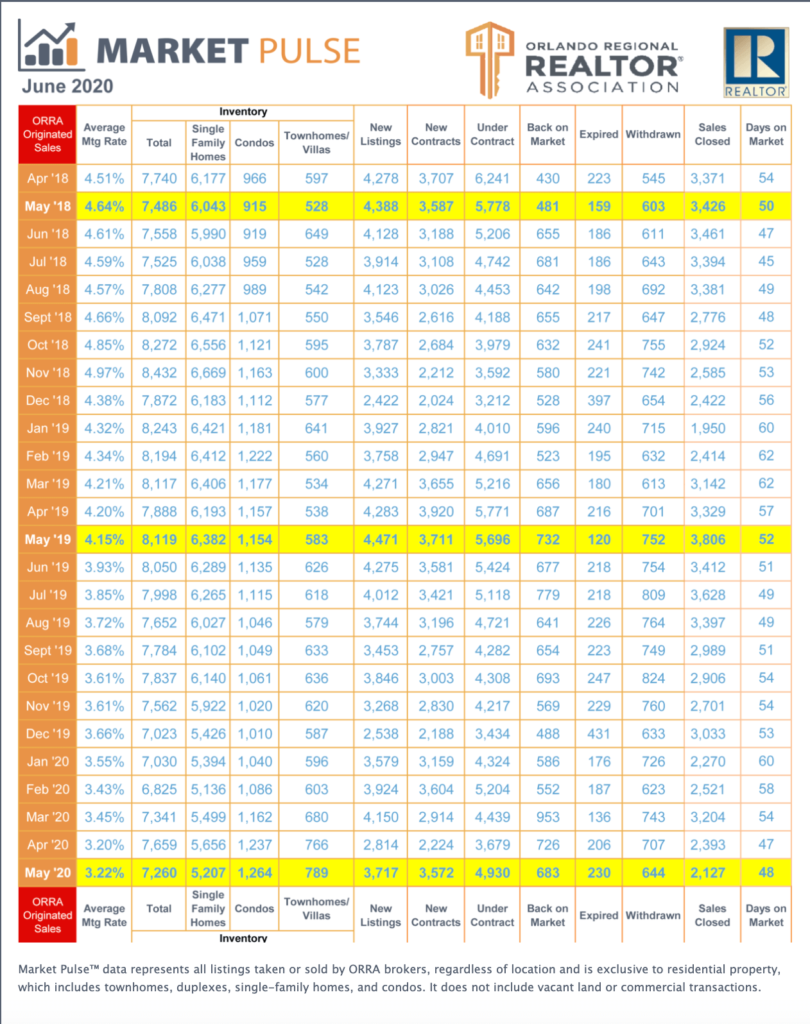
And here a quick look at the overall real estate activity in Orlando this April 2020 (as soon as May numbers are published we will update here!).
